


Week of July 13, 2026

Published every Monday: Get a detailed snapshot of what moved the markets last week—and what to watch this week.

Is the market too optimistic on oil prices?

A new round of military action in the Middle East called into question whether the Memorandum of Understanding would hold. Global stocks were mixed, with a technology rally leading the Nasdaq and S&P 500 higher. Bonds were lower, as the Fed’s June meeting minutes reiterated a hawkish outlook for rates.

Weekly Quick Hits

Beyond the Headlines

Is the market too optimistic on oil prices?

Report Releases

The Federal Open Market Committee (FOMC) meeting minutes showed several members made a case for raising rates in June.

Financial Market Data

Global stocks had a mixed week. Technology and energy were the best-performing sectors.

Looking Ahead

Updates on consumer and producer inflation will highlight a busy week of economic data.

BEYOND THE HEADLINES:

Is the market too optimistic on oil prices?

The Memorandum of Understand (MOU) to end the war in the Middle East was signed on June 17. Oil prices had been declining from their April peak of $120, as talks progressed during the ceasefire. But once the MOU was made official, the market read it has as an all-clear sign that the Strait of Hormuz would open fully and safely in short order. Oil prices came back down to the level that they were at the start of the war. This is a trend with market participants lately. The most recent data point is straight-lined into the future, treating it as the new normal. The market may turn out to be correct that the Strait will fully reopen, and oil prices will remain low for the rest of the year. However, optimism also raises the potential for the consensus to face a reality that challenges this narrative. And while the countries continue to talk, this past week saw some setbacks with renewed military action.

Higher Oil Prices Have Led to Accelerating Inflation
Success in resolving the conflict in the Middle East and fully restoring traffic through the Strait is important because the fly in the ointment from an economic perspective remains inflation. Inflation has accelerated in large part because of increased oil prices working their way through the supply chain. The most recent readings showed consumer price inflation and producer price inflation exceeded 4 and 6 percent annually, respectively. Persistent high inflation tends to lead to increases in interest rates and the economy eventually slows. Without oil prices being sustained at current levels, it’s unlikely that inflation will trend down in a meaningful way.

The Federal Reserve Remains Focused on Its Inflation Mandate
Currently the Fed doesn’t seem inclined to factor in the recent drop in oil prices in interest rate policy. New Chairman Kevin Warsh made it clear that policymakers remain firmly focused on inflation. Warsh reiterated the Fed’s commitment to its 2 percent inflation target. The June meeting minutes also showed that a few committee members made the case to raise rates based on the current data. Market participants are now discounting a rate increase at the Fed’s September 15‒16 meeting. If rates do rise, it could pressure markets.

Earnings Take Center Stage
Attention will soon turn to second-quarter earnings. Analysts are projecting approximately 24 percent year-over-year growth for the S&P 500. While this raises the risk of disappointment, recent history suggests resilience. Over the past five quarters, companies have continued to deliver strong results despite policy and trade-related uncertainties. In addition, 2026 full year S&P 500 earnings estimates have moved up almost 9 percent since the end of February. Equally as encouraging for investors is that the 493 non‒Magnificent Seven stocks in the index are expected to grow 20 percent for the full year, according to J.P. Morgan Asset Management. If earnings growth momentum continues, it should provide a foundation for markets over the longer term. Improving fundamentals is a key to a sustainable diversified rally.


“Currently the Fed doesn't seem inclined to factor in the recent drop in oil prices in interest rate policy. New Chairman Kevin Warsh made it clear that policymakers remain firmly focused on inflation.

Report Releases: July 6–10, 2026

ISM Services

ISM Services:
June (Wednesday)

Service sector sentiment slipped modestly in June but was in line with expectations. Declines in new orders outweighed an increase in the employment component.

  • Expected/prior month ISM Services Index: 54.0/54.5
  • Actual ISM Services Index: 54.0
FOMC Meeting Minutes

FOMC Meeting Minutes:
June (Wednesday)

The minutes from the June FOMC meeting showed a Fed that remains focused on inflation. A few Fed officials saw a case for a rate hike at the June meeting. The potential for a rate increase in the fall remains on the table.

Existing Home Sales

Existing Home Sales:
June (Thursday)

Existing home sales unexpectedly fell in June against calls for a modest increase. Mortgage rates continue to have an impact on monthly sales.

  • Expected/prior month existing home sales monthly change: +1.0%/+3.7%
  • Actual existing home sales monthly change: ‒2.4%


The Takeaway


  • The highlight of the week was the minutes from the FOMC’s June meeting. While the committee decided to leave interest rates unchanged, several members thought a case could be made for a rate increase last month. The potential for rates to move higher in the fall remains on the table.

Financial Market Data

Equity

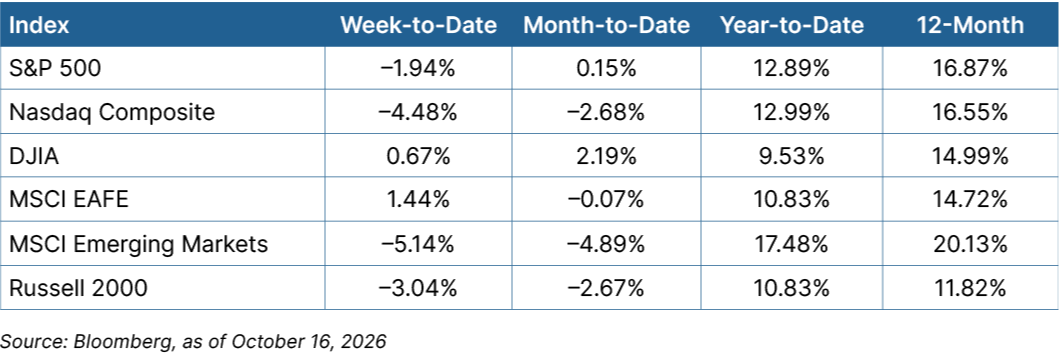
Equity markets were mixed last week, as investors wrestled with updates on negations between the U.S. and Iran. The Nasdaq and S&P 500 were both up more than 1 percent while the Dow Jones Industrial Average and the Russell 2000 declined marginally. Breadth was narrower, as the Equal Weight S&P 500 was down slightly. The technology and energy sectors were the best performing areas of the markets, rallying more than 3 percent. Materials and health care were the top laggards, both down roughly 2 percent. International markets came under pressure, with emerging markets down almost 2 percent.

Equity graphSource: Bloomberg, as of July 13, 2026

Fixed Income

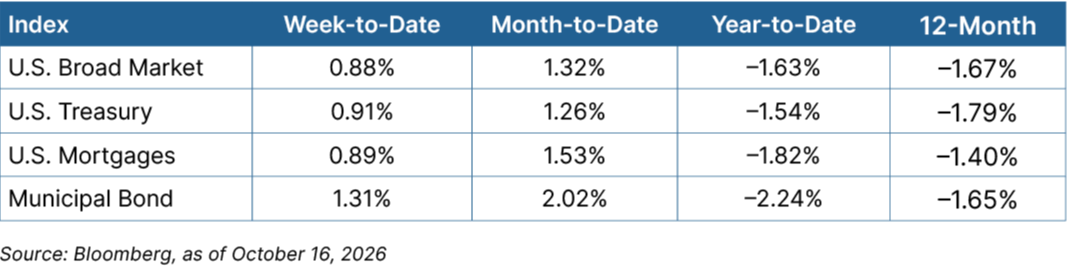
The release of the June Fed meeting minutes again illustrated the potential for interest rates to increase later in the year. Bond markets were weaker, with yields moving higher. The 10-year Treasury bond saw its yield move up by 7 basis points to 4.56 percent. Core bonds and the municipal market were dragged lower as well.

Fixed Income GraphSource: Bloomberg, as of July 13, 2026

The Takeaway


  • A mixed week for stocks saw the technology sector rally and that led to the Nasdaq and S&P 500 moving higher. International stocks were weaker.
  • Fixed income markets were weaker across the board, as the yield on the 10-year Treasury rose by 7 basis points.
Looking Ahead Image

Looking Ahead

A busy week for data is highlighted by readings on consumer and producer prices. Both should show a slight improvement due to lower oil prices. Retail sales are anticipated to increase for the sixth straight month, while consumer sentiment as measured by the University of Michigan is expected to improve for the second consecutive month. Earnings season ramps up beginning Tuesday.

  • On Tuesday, we expect to see the Consumer Price Index for June. Given the recent drop in oil prices, expectations are that the index will decline slightly from 4.2 percent to 3.8 percent year-over-year growth.
  • On Wednesday, we anticipate the Producer Price Index report for June. Expectations are that producer price inflation will also drop slightly from an elevated 6.5 percent in May.
  • An update on Retail Sales for June will be released on Thursday. Economists are expecting an increase for the sixth straight month, which bodes well for economic growth.
  • The University of Michigan Consumer Sentiment Survey July Preliminary will be released on Friday. Expectations are for a second straight month of improvement off a historic low, as energy prices decline.
  • Finally, second-quarter earnings season ramps up, with the banks beginning to report on Tuesday.

Disclosure: This material is intended for informational/educational purposes only and should not be construed as investment advice, a solicitation, or a recommendation to buy or sell any security or investment product. Diversification does not assure a profit or protect against loss in declining markets, and diversification cannot guarantee that any objective or goal will be achieved. Please contact your financial professional for more information specific to your situation.

Bonds are subject to availability and market conditions; some have call features that may affect income. Bond prices and yields are inversely related: when the price goes up, the yield goes down, and vice versa. Market risk is a consideration if sold or redeemed prior to maturity.

Certain sections of this commentary contain forward-looking statements that are based on our reasonable expectations, estimates, projections, and assumptions. Forward-looking statements are not guarantees of future performance and involve certain risks and uncertainties, which are difficult to predict. All indices are unmanaged and are not available for direct investment by the public. Past performance is not indicative of future results. The S&P 500 is based on the average performance of the 500 industrial stocks monitored by Standard & Poor’s. The Nasdaq Composite Index measures the performance of all issues listed in the Nasdaq Stock Market, except for rights, warrants, units, and convertible debentures. The Dow Jones Industrial Average is computed by summing the prices of the stocks of 30 large companies and then dividing that total by an adjusted value, one which has been adjusted over the years to account for the effects of stock splits on the prices of the 30 companies. Dividends are reinvested to reflect the actual performance of the underlying securities. The MSCI EAFE Index is a float-adjusted market capitalization index designed to measure developed market equity performance, excluding the U.S. and Canada. The MSCI Emerging Markets Index is a market capitalization-weighted index composed of companies representative of the market structure of 26 emerging market countries in Europe, Latin America, and the Pacific Basin. The Russell 2000® Index measures the performance of the 2,000 smallest companies in the Russell 3000® Index. The Bloomberg US Aggregate Bond Index is an unmanaged market value-weighted performance benchmark for investment-grade fixed-rate debt issues, including government, corporate, asset-backed, and mortgage-backed securities with maturities of at least one year. The U.S. Treasury Index is based on the auctions of U.S. Treasury bills, or on the U.S. Treasury’s daily yield curve. The Bloomberg US Mortgage Backed Securities (MBS) Index is an unmanaged market value-weighted index of 15- and 30-year fixed-rate securities backed by mortgage pools of the Government National Mortgage Association (GNMA), Federal National Mortgage Association (Fannie Mae), and the Federal Home Loan Mortgage Corporation (FHLMC), and balloon mortgages with fixed-rate coupons. The Bloomberg US Municipal Index includes investment-grade, tax-exempt, and fixed-rate bonds with long-term maturities (greater than 2 years) selected from issues larger than $50 million. One basis point is equal to 1/100th of 1 percent, or 0.01 percent.

Authored by the Investment Research team at Commonwealth Financial Network®.

© 2026 Commonwealth Financial Network®

Let’s Talk About Your Financial Future

Whether you’re navigating a volatile market or preparing for the future, we’re here to help.

Schedule a Consultation